Create a graph
Link: http://nces.ed.gov/nceskids/createAgraph/default.aspx/
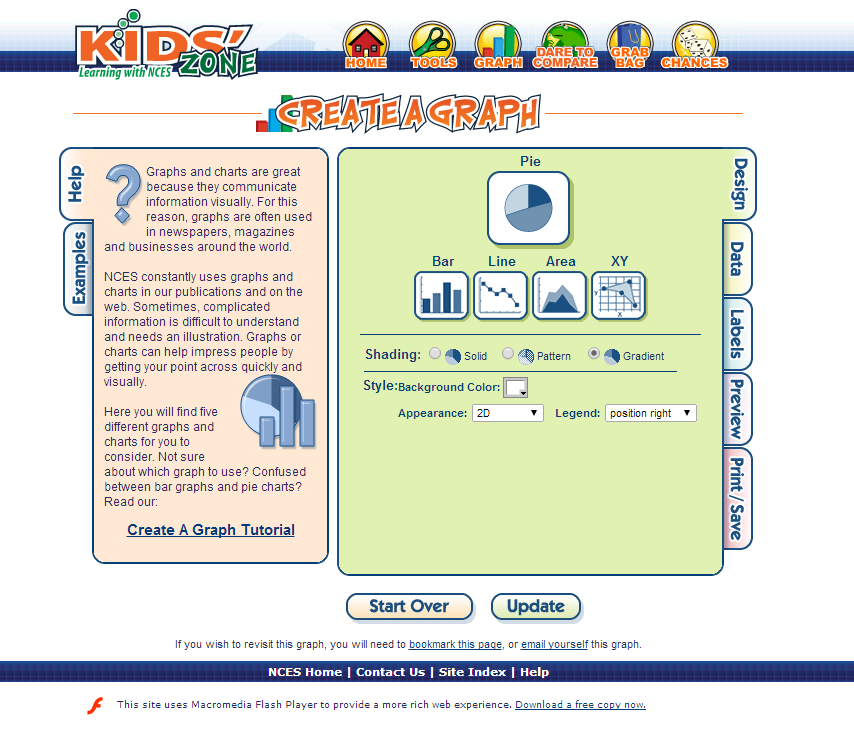
Create a Graph provided by the National Center for Education Statistics (NCES) is an online graphing tool especially designed for students to easily input data and construct different types of analytical graphs.
Create a Graph provided by the National Center for Education Statistics (NCES) is an online graphing tool especially designed for students to easily input data and construct different types of analytical graphs.

Student Activity and Engagement
As an individual computer activity or as homework, students will first gather information from secondary sources or use information provided by the teacher on the boiling and melting points of water and a range of other similar sized molecules. Using this graphing tool, students then plot suitable graphs that would allow visual observations and analysis of the comparison. Completed graphs can then be printed out or emailed to the teacher which also makes it convenient as an assessment task on data analysis and graphing skills.
Syllabus Outcomes:
NSW Chemistry Stage 6 Syllabus
Students:
- 8.4.2.3.1 process information from secondary sources to graph and compare the boiling and melting points of water with other similar sized molecules
- 11.1 identify data sources to:
e) recommend the use of an appropriate technology or strategy for data collection or gathering information that will assist efficient future analysis
- 12.3 gather information from secondary sources by:
c) extracting information from numerical data in graphs and tables as well as from written and spoken material in all its forms - 12.4 process information to:
c) best illustrate trends and patterns by selecting and using appropriate models including computer-assisted analysis
